TCD1304 Arduino CCD Transmission Spectrograph
This unit captures 800 or so pixels from the TCD1304's 3648 pixels. There is another that captures all 3648 pixels in 8-bit resolution. See the new fast 8-bit spectrograph project.
A transmission spectrograph is a device which records the spectra of light passing through a subject. In my case, the subject is a photographic or color separation filter, specifically a dichroic filter - red, green, blue, cyan, magenta, yellow, and so on. This one uses a linear image sensor and an Arduino Uno to capture the image of the spectra and pass it to a python app on the host computer which graphs the output.

An ATmega328 in the form of an Arduino Uno R3 acts as the controller for the spectrograph. The sensor is a Toshiba TCD1304AP, a 3648 pixel linear CCD sensor which operates on a single voltage (3.0V to 5.5V). The sensor is driven directly by the microcontroller, and the analog output is buffered by a transistor. The signal is digitized by an analog pin on the Arduino Uno, as a series of 800 10-bit readings.
The code subtracts the ADC value from 1023 (code below) to give it the correct polarity. And it requires no adjustments - if the circuit is wired correctly, and the parts all work, you should get a trace on the first run, assuming you don't over-expose the sensor.

I had a PC board made, bought a 10mm wide 22-pin socket, and a set of Uno R3 headers, and put together a shield for this project. I like breadboarding, and I like stuffing PC boards, but I hate hard-wiring prototypes. Prone to mistakes, and not very robust. Making a schematic, breadboarding what needs to be tested, designing a board, and stuffing it has replaced hard-wired prototypes for me. I say that, but with this project, the first thing I did was make a hard-wired version on an Arduino Uno compatible protoboard. That was a few years ago. I'm revamping this project a bit.
If you want to make or modify your own version, the KiCAD Files are available. PCBWay.com has a plugin for KiCAD, which when used will send the files to their shop and fill out a good part of the order form. You just need to add the number you want and pick a color. They charge approximately US$5 for 10 boards. Sometimes the first order is free, and then the shipping, which may be from US$15 to US$25, depending on your patience.
A PC board is not required - this circuit is simple. But a few have made errors in wiring which required some troubleshooting to fix. A PCB makes that less likely.
Microcontroller Software
Line readout consists of driving the clocks and reading the output with the ADC. The data is read in as fast as the Arduino can go, with the ADC clock sped up a little bit. The Mclk on the CCD is adjusted such that the 3648 pixels are output during the time it takes to digitize 800 readings with the ADC. It doesn't matter that the two don't match up - the CCD output is continuous, actually an analog signal, so there are no aliasing problems.
A new program for the Arduino Spectrograph without OpAmp has the code to subtract the ADC value from 1023, inverting it. The full range of values in this mode is just under 0 to 420 ADU with my Uno and my CCD. The max range would be 0 to 1023. The data is referenced to zero, and increasing light amplitude raises the output value.
The timing is such that the MCLK is 380.614kHz. Yes, that is below the specified minimum. The device is static - you could stop the clocks and restart them, and you would pick up where you left off. The minimum is what is required to meet the spec for pixels per second. This project doesn't attempt to meet the pixels per second spec. The SH clock runs around 50μS per cycle, resulting in 729 reads per line. It continues to read past the end of the CCD by 71 pixels. The ADC takes 30μS to digitize one pixel. Since the SH clock needs to be approximately 50% duty cycle, I added a 20μS delay, to square it up so one pixel time is 50μS. You can adjust the number of pixels by decreasing the delay on line 76. Don't over do it - It still needs to look enough like a square wave. Don't go past 800 pixels or you'll run out of RAM.
When you program the Arduino Uno you will get a warning that you're about out of RAM. That's Ok. There is more than enough for the code to run reliably.
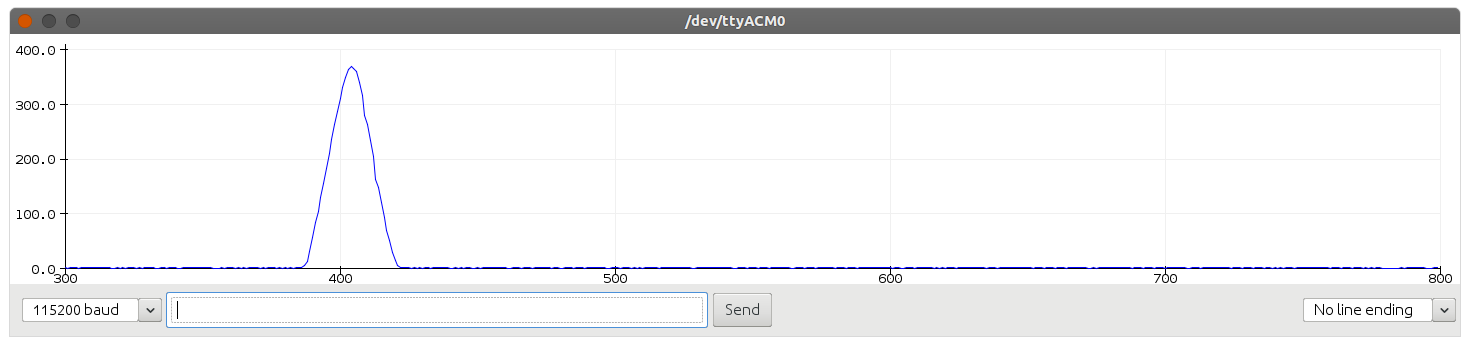
I used the serial plotter on the Arduino tools menu, and it worked great except that the maximum number of displayed points is 500, so it shows samples 300 to 800, cutting off everything below that. It's good for debugging, though.
Commands
- r - Readout
- e123 - Exposure time (mS)
Mechanics
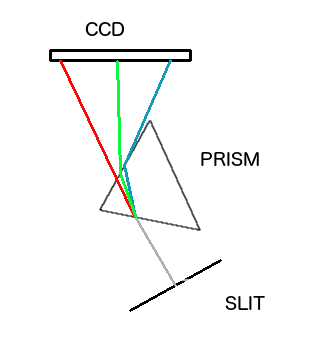
So far we've only done the electronics. There are some mechanical/optical tasks to do as well. A spectrograph has to break the light into its constituent colors in order to measure them. There are three ways to do that, and I tried two of them. A prism and a broken DVD. Both worked. I did not try a transmission diffraction grating. I don't have one to try, and they cost too much for this project. No matter which type you use, you must use a slit. I used two utility knife replacement blades edge to edge, with a piece of stiff paper between to space them. Screwing them down over a drilled hole, then removing the paper, leaves a tiny little slit that is just what is needed. A real spectrograph might have a slit measured in tens of microns, but for just measuring the pass band of a few filters, this is good.
To use a prism, the angles of the light entering, the prism angle, and the distance to the CCD must be figured out. It is possible, but insane, to calculate these angles. It is best to set it all up on the kitchen table with the lights out and just measure the result. Make your setup adjustable, so you can calibrate on a known wavelength. One problem I encountered with a prism is the distance between the prism and the detector is considerable.
To use a DVD or CD, you should do the same thing, but since they sort of reflect the spectrum, you will position the CCD in a different place than when using a prism. The light is not reflected, though. It is at a different angle than if it were just reflected. Again, darkness is your friend.
Total investment in this project was less than $20, although the current price for the TCD1304 has gone up. It appears to work great, electrically. I will refine the mechanics a little to toughen it up, and provide the collimated light source. Those two things should make it perfect for measuring overlap in dichroic filters.
Some Angles and the Host Software
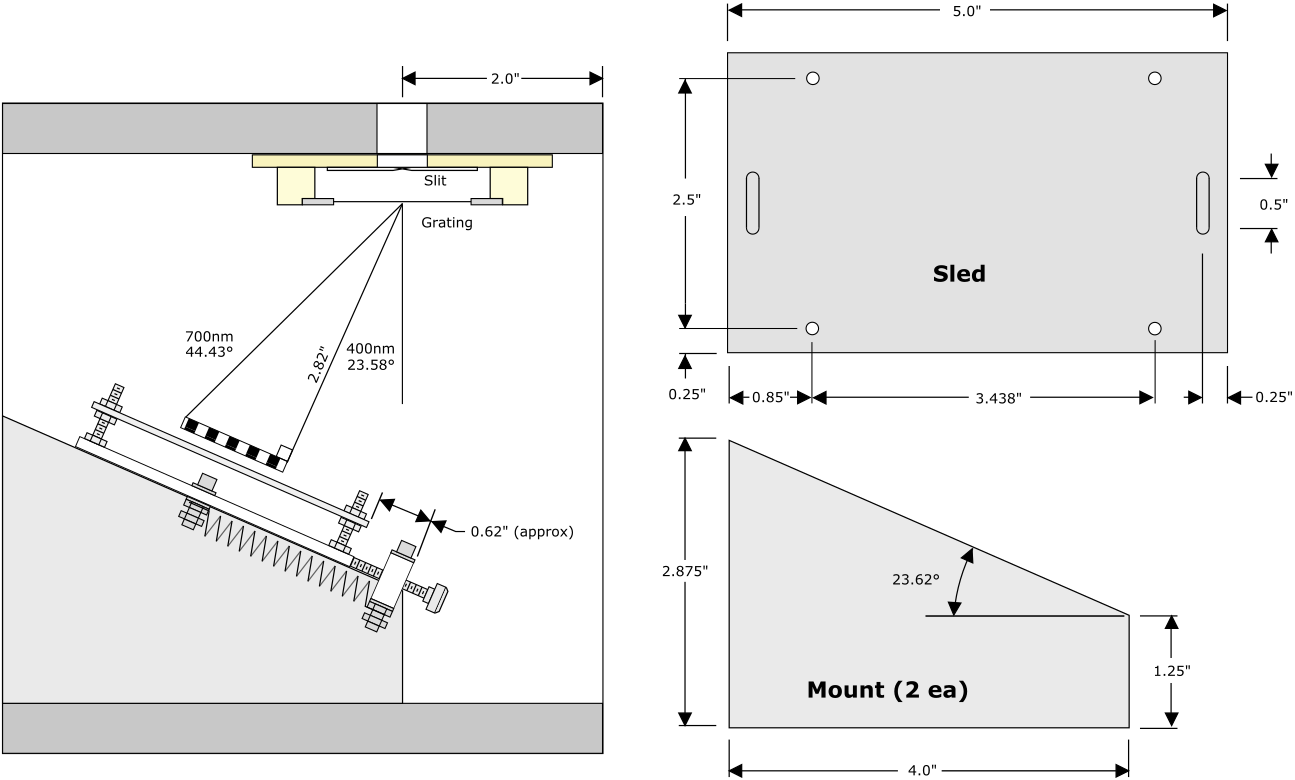
I did manage to get some film holographic transmission gratings to play around with. I designed, but have not yet built, a bottom end for a better spectrograph using these 1000 lines per millimeter gratings. The key takeaways from the drawing are the angles required and the way to achieve them.
One of the most important dimensions is the 2.82 inches between the grating and the CCD. That is 71628 microns, and goes with the 36.48 microns per pixel (3648 phys. pixels x 8 microns / 800 logical pixels). The math depends on those two numbers being proportional. The 800 pixels are 29184 microns long, non-adjustable, so it becomes important that the 2.82 inch (71.628mm) distance is accurate as well. I have an idea how I'm going to do it using a cardboard triangle to set the closest end of the sensor at 400nm and the spacing at 71.6mm.
Built to the drawing, the sensor should have 400nm lined up with the first pixel, and 718nm should fall in place on the last pixel. Within reason. In between, the pixel can be translated into a wavelength by some trigonometry:
wavelength in nm = math.degrees(math.atan(pixel / 1963.4868)) / 0.0695 + 400
That's python if it isn't obvious, and it yields:
pixel 0 = 400.00nm
pixel 399 = 565.28nm
pixel 799 = 718.60nm
That gets you the wavelength at any given pixel. But we also want the pixel of any given wavelength, so we can put up a grid. That is:
pixel = math.tan(math.radians((wavelength - 400) * 0.0695)) * 1963.4868
Which gives us:
400.00nm = pixel 0.00
565.28nm = pixel 399.01
718.60nm = pixel 798.99
Armed with these two lines of code, one could write a python app to display the output with a grid labeled with wavelength, and be pretty confident in the numbers.
A Little Python App
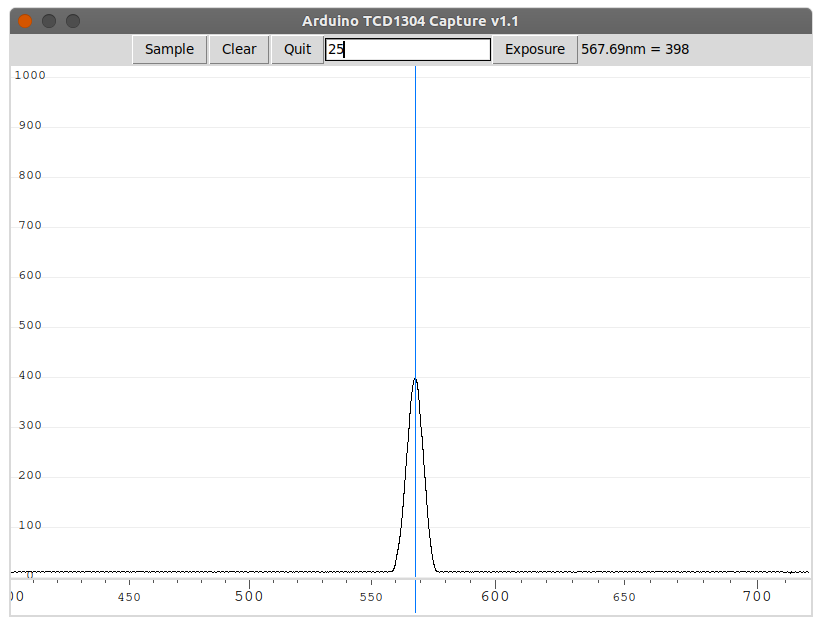
I put together such an app, to read the Arduino (the no-op-amp code above) and display the result. It beats copying and pasting all the values into a spreadsheet, but you can still use the spreadsheet if you want. It outputs a csv file in the directory from which it is run. It has a cursor and displays the wavelength and amplitude values of the point at the cursor.
Before you run it, you need to put the com port in near the bottom of the file, where it says:
app = Application(master=root, port="/dev/ttyACM0", exposure=30)
Replace /dev/ttyACM0 with COM4 or /dev/cu.ttyUSB-12345 or whatever your port is.
It isn't obvious that to get the blue cursor you have to hover over the number area at the bottom of the window. The numbers on the right end of the header are the wavelength and value at the blue cursor. A left-click will freeze the cursor and a right-click on either white area will remove the cursor.
To end the app, click the "Quit" button, or just hit the "x" button on the window frame.
"Clear" clears the display. Multiple scans just stack up on the screen until you hit clear.
If you need to change the exposure time, you change it in the input field, then click "Exposure". Set the exposure time to a value that keeps the output linear. 2x the exposure should give 2x the output. Exactly. If it doesn't, it is non-linear, and you need to back it off.
Download the python app. You will need PySerial:
pip install pyserial
And tkinter. You usually install tkinter with the OS supplied installer, for instance apt with Debian/Ubuntu:
sudo apt-get install python-tk